A Distributional Cost-of-Living Index From Aggregate Data
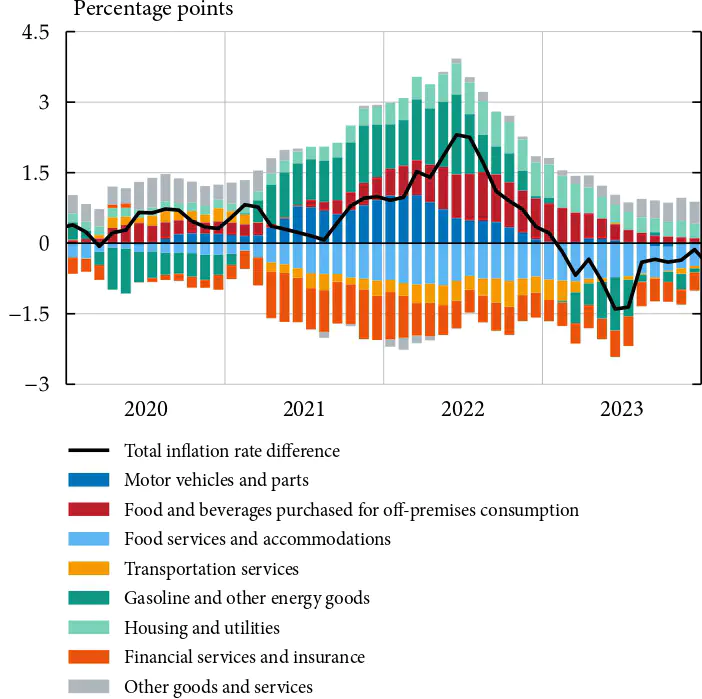 PCE inflation rate difference between top and bottom deciles
Abstract
This paper proposes a method to measure individual and aggregate changes in the cost of living when consumer behavior is nonhomothetic and microdata on consumption expenditures are not available. Aggregate prices and expenditure shares together with a single cross-sectional expenditure distribution are sufficient to create a distribution of nonhomothetic cost-of-living indices. The cost-of-living indices nest the homothetic Törnqvist price index as a limit case and only contain one unknown parameter, which is identified from macro data without aggregation bias. Using US Personal Consumption Expenditure (PCE) data, we construct nonhomothetic PCE price indices covering 71 product groups for the period 1959 to 2023. These indices reveal a 0.41 percentage point gap in annual inflation rates between the poorest and richest ten percent since 1959 and a 1.3 percentage point gap throughout 2022, thus suggesting that poorer households are hit harder both in the long run and in the recent inflation surge.