Markus Pettersson
Markus Pettersson
Home
Research
Papers
Search
CV
Contact
Publications
Philipp Hochmuth
,
Markus Pettersson
,
Christoffer Jessen Weissert
(2025).
A Distributional Cost-of-Living Index From Aggregate Data
.
Review of Income and Wealth
, vol. 71(4), pp. 1–18.
Article (open access)
Working paper
Replication code
Working papers
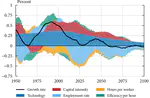
Endogenous Technological Change Along the Demographic Transition
Does population ageing hurt output per capita? Standard life-cycle models with exogenous growth that emphasise two opposing forces, …
Markus Pettersson
Working paper
Getting Real About Wages: A Nonhomothetic Wage Deflator
Conventional real wages—nominal wages divided by a consumption deflator—are biased from a welfare perspective when …
Saman Darougheh
,
Philipp Hochmuth
,
Markus Pettersson
,
Márcia Silva Pereira
Working paper
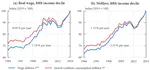
A Nonhomothetic Price Index and Cost-of-Living Inequality
We derive a price index based on nonhomothetic preferences and use it to document cost-ofliving inequality in the United States. Our …
Philipp Hochmuth
,
Markus Pettersson
,
Christoffer Jessen Weissert
Working paper
Online appendix
Video
Work in progress
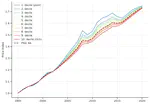
A Century of Real Consumption Growth with Income-Dependent Preferences
Recent evidence from the price index literature suggest that conventional price indices understate long-run inflation—and …
Markus Pettersson
Modelling Income Tax Functions Under Heterogeneous Household Composition: A Unified Framework and Empirical Estimates for Macroeconomic Analysis
Many tax systems differentiate between households based on their composition, for example through joint taxation of married couples or …
Markus Pettersson
Real Consumption Inequality over the Last Half Century: Evidence Using the PSID Consumption Measure and Heterogeneous Inflation Rates
This project investigates the evolution of real consumption inequality when we account for consumption-specific inflation rates but …
Markus Pettersson
Cite
×